This blog article is written by Ahmed Elsherif, a Search Engine Optimisation Specialist at Ferratum, the consumer lending business unit of Multitude Group. His role is to optimise and improve Ferratum’s websites visibility, search engine rankings, and organic traffic through different strategies and techniques. He created and managed the Ferratum Insights project to collect, study, and share insights about microeconomic trends derived from consumer behaviour data and create financial awareness for individuals to make more informed decisions.
The war in Ukraine, which started over a year ago, has caused economic shockwaves that led to higher prices across Europe, resulting in record-breaking inflation rates surpassing those of the 2008 global financial crisis.
Ferratum's most recent study, Ferratum Insights, conducted in late 2022, focused on capturing the effects of inflation on a microeconomic level by surveying 7,831 participants across all 13 markets in Europe. The study aimed to collect comparable data on spending behaviour during the peak inflation period in each market by surveying individuals across Europe. To make the findings more accessible, we have summarized the collected data, which can be found here in 13 languages.
In this article, we wanted to get a deeper insight into the following hypothesis:
“Inflation has widened the gap between high and low-income earners in terms of savings and financial stability.”
Inflation has significant effects on financial well-being, widening the gap between high and low-income earners. Vulnerable populations are hit hardest by job losses, income instability, and increased expenses, exacerbating existing inequalities. It is crucial to recognize the unequal burden placed on those already facing financial challenges.
Key Findings from the Study
- Above-average earners were more likely to receive a salary increase compared to below-average earners.
- People who didn't receive a salary increase were more impacted by expenses and more likely to get loans for essential needs.
- The number of people unable to save money from their income increased from 24% to 57% between 2021 and 2022.
- The majority of below-average income earners saved less than 1% of their income in 2022, while above-average earners had higher savings.
|
Income level ranges
During our survey, we requested participants to indicate their monthly salary range by checking the appropriate box. Then, we compared their income levels to the national gross income of their country, as per data from trading economics. Based on this, we divided the respondents into three categories: below-average, average, and above-average earners.
Comparing the Impact on below vs above-average income levels
A study by the EU Joint Research Centre found that inflation affects low-income earners in Central and Eastern Europe more due to their higher proportion of spending on food and energy. The impact varied between 7% and 30% for different countries and income levels, exacerbating social inequalities in the European Union.
After reviewing income levels and salary raises received in the 6 months before the survey, we observed a noticeable difference between above and below-average respondents.
45% of above-average earners reported receiving a salary increase, while only 24% of below-average earners did the same.
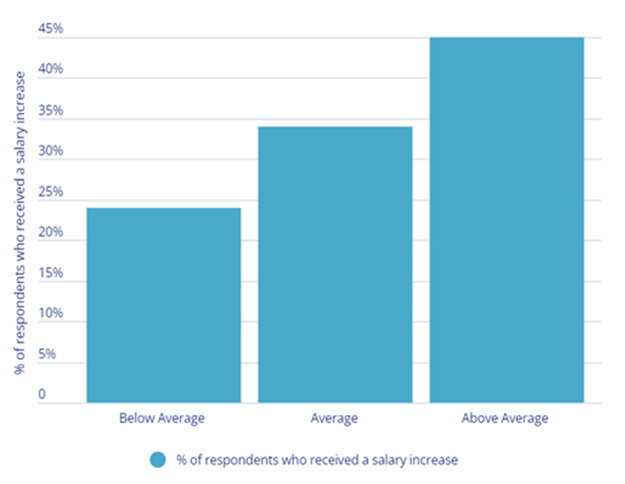
Figure 1. The percentage of respondents from each income group that received a salary raise during the 6 months prior to the survey.
The Harmonized Index of Consumer Prices (HICP)* - which is an economic indicator that measures the average change in prices of goods and services consumed by households in the EU, Norway, Iceland, and Switzerland - rose from 1.9% in June 2021 to 10.6% in October 2022, before falling to 9.2% in December 2022. For below-average earners, who may already be struggling to make ends meet, this increase in prices can have a significant impact on their ability to afford basic necessities.
*The Harmonised Index of Consumer Prices (HICP) is used to measure consumer price inflation. That means the change over time in the prices of consumer goods and services purchased by households.
The sharp rise in HICP has not only affected the ability of below-average earners to afford basic necessities but has also impacted their spending behaviour.
This can be seen when comparing metrics in our data related to spendings behaviour, as people who did not receive a salary increase, generally were:
- More impacted by energy, food, household expenses, and entertainment expenses.
- More likely to get a loan for electric bills, heating bills, and food expenses.
- More likely to reduce their spending on food, Entertainment, and travel.
|
In comparison those who received a salary increase prior to the survey.
The number of people unable to save increased from 24% to 57% between 2021 and 2022.
The survey asked people about their monthly savings a month before the survey (during inflation) compared to the year before, we noticed a significant increase in the percentage of people who did not manage to save money from their income and that figure has more than doubled between 2021 and 2022 (from 24% to 57%), as shown in figure 2.
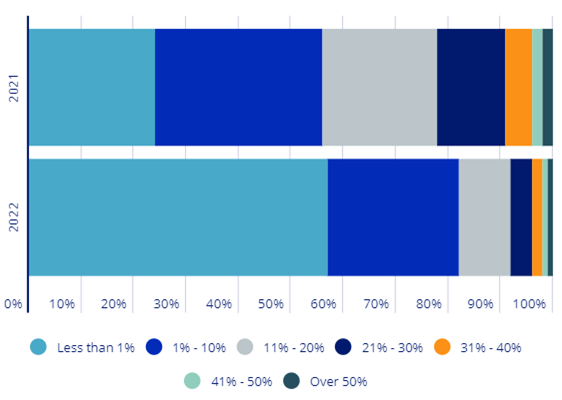
Figure 2. The percentage of monthly income that respondents were able to save on average in 2021 versus 2022.
However, the above figure includes all income levels and does not provide a complete picture when comparing the savings distribution for each income group. Figures 3 and 4 break down the difference between below vs above-average income earners for all surveyed markets during 2021 and 2022.
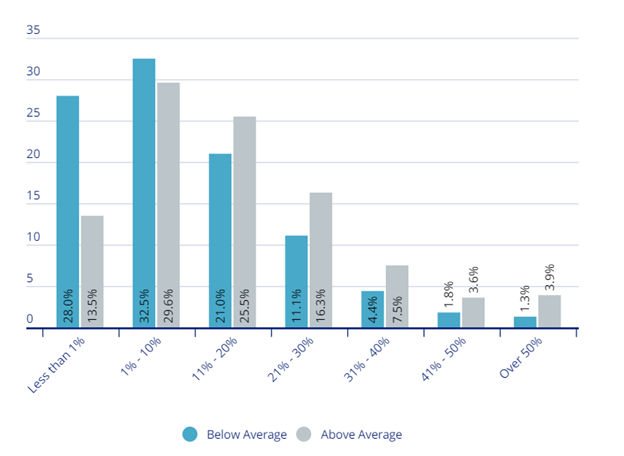
Figure 3. A comparison of the average monthly savings between below-average vs above-average income earners in 2021.
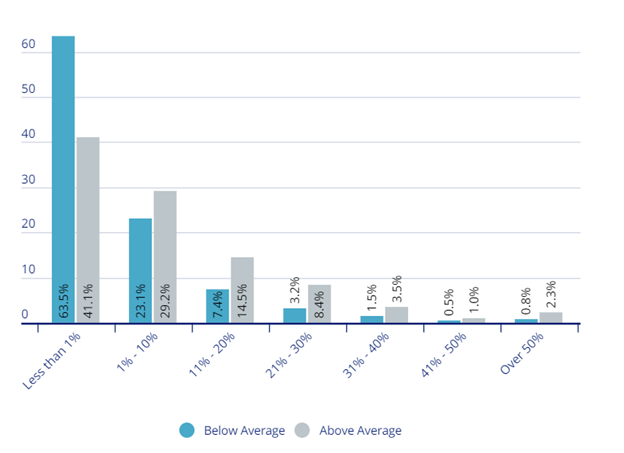
Figure 4. A comparison of the average monthly savings between below-average vs above-average income earners in 2022.
Saving Disparities: A Closer Look at Income Levels and Savings Rates
When diving deeper, we discover that those who indicated saving less than 1% of their income in 2022 were predominantly saving 1-10% in 2021. Although there is a significant shift towards saving less for both income levels, the majority of below-average income earners (63%) have saved less than 1% of their income, while above-average income earners remain more spread out across different higher savings categories.
Conclusion
This article highlights that there is a significant gap between below and above-average salary earners in terms of receiving a salary increase during the inflation period, with above-average earners being more likely to receive a salary increase. Additionally, our data shows that people who received a salary increase were less impacted by certain expenses and less likely to need a loan for essential expenses compared to those who did not receive a salary increase. To determine the classification of below and above-average earners, we defined it by comparing their income levels to the national gross income of their country.
Furthermore, the article reports a significant increase in the percentage of people who did not manage to save money from their income during the inflation period, with the majority of below-average income earners not being able to save more than 1% of their income. This suggests that there is a wider gap between high and low-income earners in terms of savings and financial stability, as the article hypothesized.
Overall, the article provides data supporting the hypothesis that inflation has widened the gap between high and low-income earners in terms of savings and financial stability.
Potential limitation of this study
The uneven response rate of the different income levels in the survey is a potential limitation. Below-average earners represent 41% of the responses, while average earners represent 48%, and above-average earners represent only 12% of the respondents. However, similar patterns can be seen in countries where we have an equal or close ratio of respondents between below and above average earners such as those in Sweden and Czechia, which also confirms the hypothesis proposed in this article.
Disclaimer: The information provided in this article is intended for general informational purposes only. It is not intended to be, and should not be taken as, professional or financial advice.
Disclaimer: The information provided in this article is intended for general informational purposes only. It is not intended to be, and should not be taken as, professional or financial advice.